How to Check Performance with Unreal Engine 5
Optimizing Unreal Engine 5 (UE5) games is essential for delivering smooth gameplay and an engaging player experience. This guide will teach you how to check performance with Unreal Engine 5 using its built-in tools and provide actionable tips for optimizing your game for better performance.
Why Performance Optimization Matters
Performance optimization is crucial in game development to ensure that your game runs smoothly across various hardware setups. Poorly optimized games can lead to frame drops, stuttering, and even crashes, which can negatively impact user satisfaction. Players expect a seamless experience, and any lag or hitch can detract from the immersion of your game. Therefore, understanding how to check performance with Unreal Engine 5 is the first step toward creating a polished final product.
Tools to Check Performance in UE5
To optimize performance effectively, you first need to identify bottlenecks in your game. Unreal Engine 5 offers several powerful tools that help you analyze your game’s performance:
1. Stat Commands
Stat commands are real-time tools that display key metrics during gameplay. Here are some essential commands:
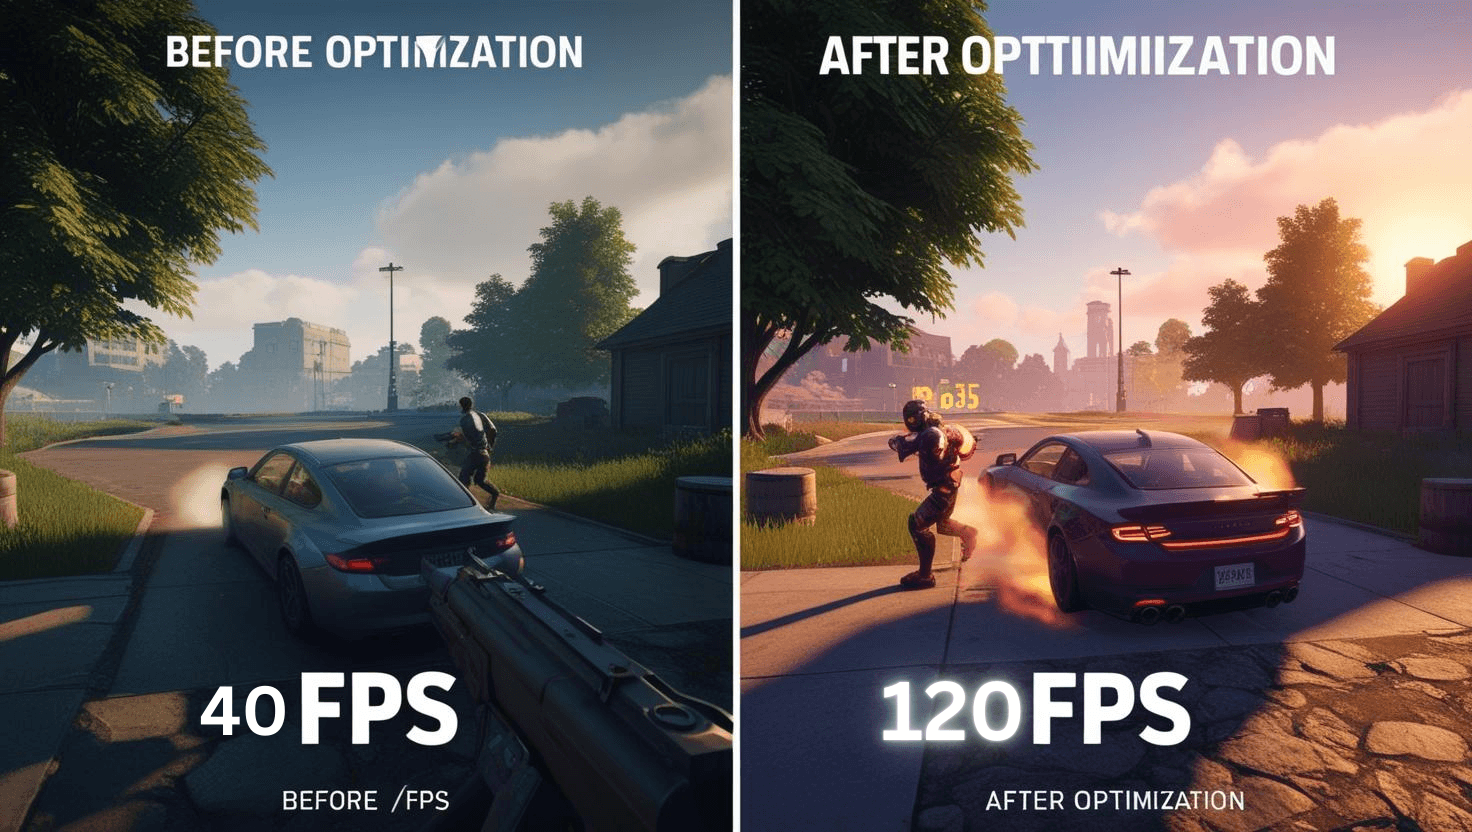
- stat fps: Displays the current frames per second (FPS), giving you a quick view of how well your game performs.
- stat unit: Shows detailed timing information for the game thread, render thread, and GPU, helping you identify where time is being spent during each frame.
- profile gpu: Provides insights into GPU usage and identifies rendering bottlenecks, allowing you to pinpoint specific areas that may need optimization.
2. Unreal Insights
Unreal Insights is a comprehensive profiling tool that captures detailed data about your game’s CPU and GPU usage:
- Enable tracing in your project settings to start recording performance data during gameplay sessions.
- Use the timeline view in Unreal Insights to analyze frame times and identify areas causing delays. This data can be invaluable for understanding how different systems interact within your game.
3. Gameplay Debugger
The Gameplay Debugger provides real-time statistics about various aspects of your game, such as AI behavior, physics interactions, and rendering performance. This tool allows developers to see how different elements of their game perform under real conditions.
4. GPU Visualizer
The GPU Visualizer helps pinpoint GPU-intensive processes like lighting and post-processing effects that may need optimization. By identifying which visual elements are taxing the GPU, you can make informed decisions about where to focus your optimization efforts.
Optimizing Performance in UE5 Games
Once you’ve identified bottlenecks in your game’s performance, you can apply several optimization strategies:
1. Asset Optimization
- Level of Detail (LOD): Use LOD techniques to reduce polygon counts on models that are far from the camera. This helps maintain visual quality without overloading the GPU.
- Material Simplification: Simplify material setups by reducing texture sizes and using fewer shader nodes. Complex materials can significantly impact rendering performance.
2. Lighting Adjustments
- Static vs Dynamic Lighting: Replace dynamic lights with static or baked lighting where possible to reduce real-time calculations. Static lights require less processing power and can improve frame rates.
- Lightmaps: Use lightmaps effectively by baking lighting into textures for static objects, minimizing the need for real-time lighting calculations.
3. Culling Techniques
Implementing culling techniques is essential for optimizing rendering performance:
- Occlusion Culling: Prevents rendering objects that are not visible because they are blocked by other objects.
- Frustum Culling: Ensures only objects within the camera’s view are rendered.
- Distance Culling: Stops rendering objects beyond a certain distance from the camera, further reducing draw calls.
4. Rendering Optimization
- Deferred vs Forward Rendering: Switch from deferred rendering (the default) to forward rendering if targeting low-end hardware or VR platforms. This adjustment can lead to improved performance in specific scenarios.
- Post-Processing Effects: Limit resource-heavy post-processing effects like bloom, motion blur, and depth of field as they can be taxing on both CPU and GPU resources.
5. Blueprint Optimization
Convert frequently used Blueprints into C++ code through blueprint nativization for faster execution and reduced overhead on the CPU. This method allows for more efficient memory management and execution speed.
6. Virtual Texturing
Enable streaming virtual textures in your project settings to manage memory usage more efficiently while maintaining high visual quality for textures in large scenes.
Testing Across Hardware Configurations
To ensure your game performs well across different devices:
- Regularly test scalability settings in UE5, which automatically adjust graphics quality based on user hardware capabilities.
- Conduct tests on low-end PCs or consoles frequently during development to identify potential issues early on.

Conclusion
By learning how to check performance with Unreal Engine 5 using tools like stat commands, Unreal Insights, and the Gameplay Debugger, you can identify bottlenecks and apply targeted optimizations such as asset management, lighting adjustments, culling techniques, and rendering tweaks. These strategies will ensure smoother gameplay across devices while maintaining visual fidelity—ultimately enhancing the player experience. Continuous monitoring and adjustments will help you meet the high standards expected in today’s gaming landscape, ensuring that players enjoy a seamless gaming experience that showcases your hard work and creativity as a developer.
Check out our other content :
- The Best Razer Keyboards of 2025: Ultimate Guide to Gaming Keyboards: Discover the top Razer keyboards that can elevate your gaming experience with precision and style.
- The Ultimate Guide to Choosing the Best Laptops for Gamers and Game Developers 2025: Find the perfect laptop that balances power and portability for both gaming and game development.
- Premium Ergonomic Gaming Thrones: Ultimate Comfort for US Gamers: Learn about the best ergonomic gaming chairs designed for comfort during those long gaming sessions.
- Is Cloud Gaming Xbox The Future?: Delve into the pros and cons of Xbox Cloud Gaming and its potential impact on the future of gaming.
- Best Gaming Monitor To Buy in 2025 | Budget Friendly: Explore budget-friendly gaming monitors that can take your visual experience to the next level.